Spectrograms
- is a visual representation of the spectrum of frequencies of a signal as it varies with time
- when applied to an audio signal, spectrograms are sometimes called sonographs, voiceprints, or voicegrams
- when the data are represented in a 3D plot they may be called waterfall displays
Algorithms Used to Create Spectrograms
see: Spectrogram Producing Algorithms
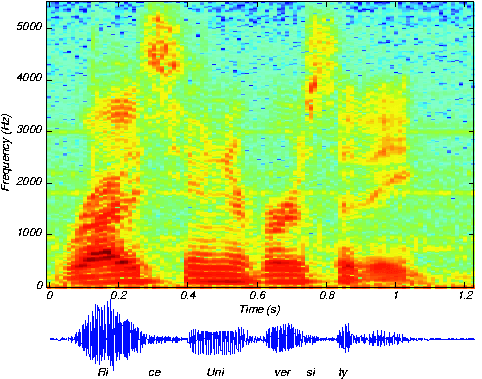
Spectrogram Examples